Electronic Reporting Why You Should Focus On The IFRS Taxonomy Now
IFRS Taxonomy certainly isn't newit's been around since 2016but it's made a comeback as the mandatory adoption date creeps closer.
If you're out of the loop, the date for public companies to prepare consolidated financial statements under IFRS is 1 January 2020. From this date on, all financial reports must comply with the European Single Electronic Format (ESEF Taxonomy) which essentially corresponds to the IFRS Taxonomy.
If you need an ESEF refresher, check out my blog here.
What is the IFRS Taxonomy exactly?
The IFRS Taxonomy is essentially a list of specific codes (elements) that preparers can use to identify (by XBRL tagging) information disclosed in IFRS financial statements. For example, the element "Cost of Sales" is listed under the element label "Cost of Sales", including a reference to the specific IAS standard and a definition of the element.
For the visual learners amongst us, I've included an example below:
Element label Cost of Sales Element reference IAS 1.99 Disclosure
IAS 1.103 Disclosure
Element documentation label The amount of costs relating to expenses directly or indirectly attributed to the goods or services sold, which may include, but are not limited to, costs previously included in the measurement of inventory that has now been sold, unallocated production overheads and abnormal amounts of production costs of inventories The 2019 IFRS Taxonomy Illustrated is a great aid here. In fact, the IASB has an entire page dedicated to this topic with an overview of the IFRS Taxonomy, annual illustratives, specific taxonomy updates per year as well as other general resources and news. For first time users, I really recommend you head on over there to help you understand the basics.
Why is it important?
The IFRS Taxonomy is important because each financial statement element will be identified via a unique tag. This transforms the financial information into a machine-readable format which is expected to aid investors and analysts in the efficient and timely analysis thereof.
Furthermore, this functionality has the potential to reduce information asymmetry, increase the efficiency of financial markets globally and generally improve the analysis of financial statements.
Here are some examples of value-added usage:
Comparing data over several companies using...
To continue reading
Request your trialSubscribers can access the reported version of this case.
You can sign up for a trial and make the most of our service including these benefits.
Why Sign-up to vLex?
-
Over 100 Countries
Search over 120 million documents from over 100 countries including primary and secondary collections of legislation, case law, regulations, practical law, news, forms and contracts, books, journals, and more.
-
Thousands of Data Sources
Updated daily, vLex brings together legal information from over 750 publishing partners, providing access to over 2,500 legal and news sources from the world’s leading publishers.
-
Find What You Need, Quickly
Advanced A.I. technology developed exclusively by vLex editorially enriches legal information to make it accessible, with instant translation into 14 languages for enhanced discoverability and comparative research.
-
Over 2 million registered users
Founded over 20 years ago, vLex provides a first-class and comprehensive service for lawyers, law firms, government departments, and law schools around the world.
Subscribers are able to see a list of all the cited cases and legislation of a document.
You can sign up for a trial and make the most of our service including these benefits.
Why Sign-up to vLex?
-
Over 100 Countries
Search over 120 million documents from over 100 countries including primary and secondary collections of legislation, case law, regulations, practical law, news, forms and contracts, books, journals, and more.
-
Thousands of Data Sources
Updated daily, vLex brings together legal information from over 750 publishing partners, providing access to over 2,500 legal and news sources from the world’s leading publishers.
-
Find What You Need, Quickly
Advanced A.I. technology developed exclusively by vLex editorially enriches legal information to make it accessible, with instant translation into 14 languages for enhanced discoverability and comparative research.
-
Over 2 million registered users
Founded over 20 years ago, vLex provides a first-class and comprehensive service for lawyers, law firms, government departments, and law schools around the world.
Subscribers are able to see a list of all the documents that have cited the case.
You can sign up for a trial and make the most of our service including these benefits.
Why Sign-up to vLex?
-
Over 100 Countries
Search over 120 million documents from over 100 countries including primary and secondary collections of legislation, case law, regulations, practical law, news, forms and contracts, books, journals, and more.
-
Thousands of Data Sources
Updated daily, vLex brings together legal information from over 750 publishing partners, providing access to over 2,500 legal and news sources from the world’s leading publishers.
-
Find What You Need, Quickly
Advanced A.I. technology developed exclusively by vLex editorially enriches legal information to make it accessible, with instant translation into 14 languages for enhanced discoverability and comparative research.
-
Over 2 million registered users
Founded over 20 years ago, vLex provides a first-class and comprehensive service for lawyers, law firms, government departments, and law schools around the world.
Subscribers are able to see the revised versions of legislation with amendments.
You can sign up for a trial and make the most of our service including these benefits.
Why Sign-up to vLex?
-
Over 100 Countries
Search over 120 million documents from over 100 countries including primary and secondary collections of legislation, case law, regulations, practical law, news, forms and contracts, books, journals, and more.
-
Thousands of Data Sources
Updated daily, vLex brings together legal information from over 750 publishing partners, providing access to over 2,500 legal and news sources from the world’s leading publishers.
-
Find What You Need, Quickly
Advanced A.I. technology developed exclusively by vLex editorially enriches legal information to make it accessible, with instant translation into 14 languages for enhanced discoverability and comparative research.
-
Over 2 million registered users
Founded over 20 years ago, vLex provides a first-class and comprehensive service for lawyers, law firms, government departments, and law schools around the world.
Subscribers are able to see any amendments made to the case.
You can sign up for a trial and make the most of our service including these benefits.
Why Sign-up to vLex?
-
Over 100 Countries
Search over 120 million documents from over 100 countries including primary and secondary collections of legislation, case law, regulations, practical law, news, forms and contracts, books, journals, and more.
-
Thousands of Data Sources
Updated daily, vLex brings together legal information from over 750 publishing partners, providing access to over 2,500 legal and news sources from the world’s leading publishers.
-
Find What You Need, Quickly
Advanced A.I. technology developed exclusively by vLex editorially enriches legal information to make it accessible, with instant translation into 14 languages for enhanced discoverability and comparative research.
-
Over 2 million registered users
Founded over 20 years ago, vLex provides a first-class and comprehensive service for lawyers, law firms, government departments, and law schools around the world.
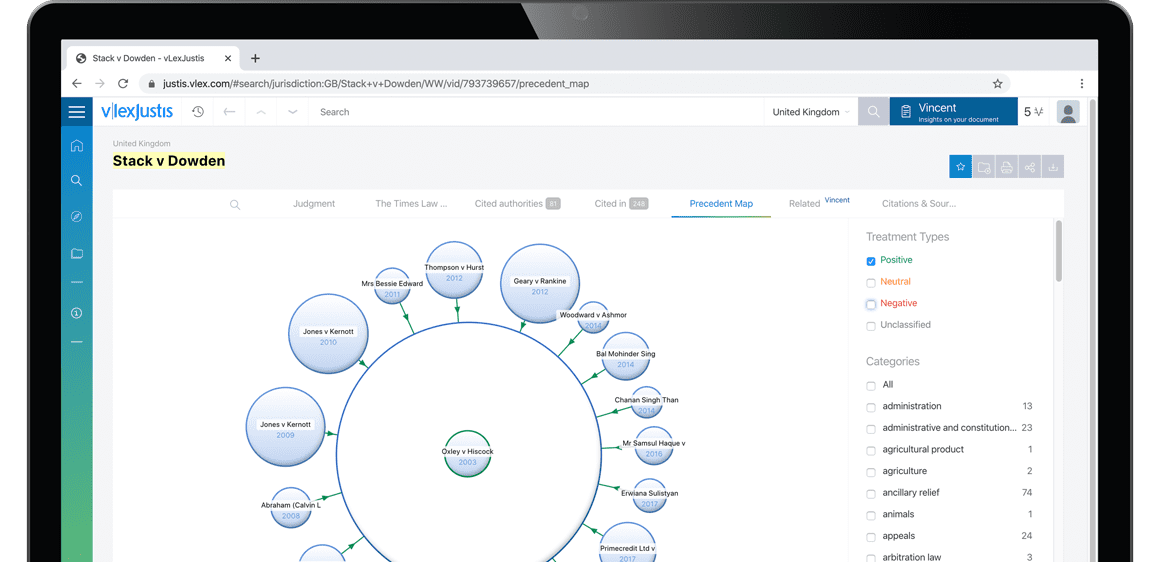
Subscribers are able to see a visualisation of a case and its relationships to other cases. An alternative to lists of cases, the Precedent Map makes it easier to establish which ones may be of most relevance to your research and prioritise further reading. You also get a useful overview of how the case was received.
Why Sign-up to vLex?
-
Over 100 Countries
Search over 120 million documents from over 100 countries including primary and secondary collections of legislation, case law, regulations, practical law, news, forms and contracts, books, journals, and more.
-
Thousands of Data Sources
Updated daily, vLex brings together legal information from over 750 publishing partners, providing access to over 2,500 legal and news sources from the world’s leading publishers.
-
Find What You Need, Quickly
Advanced A.I. technology developed exclusively by vLex editorially enriches legal information to make it accessible, with instant translation into 14 languages for enhanced discoverability and comparative research.
-
Over 2 million registered users
Founded over 20 years ago, vLex provides a first-class and comprehensive service for lawyers, law firms, government departments, and law schools around the world.
Subscribers are able to see the list of results connected to your document through the topics and citations Vincent found.
You can sign up for a trial and make the most of our service including these benefits.
Why Sign-up to vLex?
-
Over 100 Countries
Search over 120 million documents from over 100 countries including primary and secondary collections of legislation, case law, regulations, practical law, news, forms and contracts, books, journals, and more.
-
Thousands of Data Sources
Updated daily, vLex brings together legal information from over 750 publishing partners, providing access to over 2,500 legal and news sources from the world’s leading publishers.
-
Find What You Need, Quickly
Advanced A.I. technology developed exclusively by vLex editorially enriches legal information to make it accessible, with instant translation into 14 languages for enhanced discoverability and comparative research.
-
Over 2 million registered users
Founded over 20 years ago, vLex provides a first-class and comprehensive service for lawyers, law firms, government departments, and law schools around the world.